I'm just putting a few things that I think address the shape of the earth in respectable ways, just in case I decide I want to weigh in sometime.
This first video is one in which the presenter is doing an experiment which would demonstrate the specific geometric relationships between three points of know relationships to a calm flat body of water. This is a crucial piece of information because it determines a starting point for then gathering other information to determine the overall shape. I have been disappointed with other videos for being too cavalier about measuring the specific relationship of the camera to the water's surface.
I take this experiment to establish clearly that three points that are all exactly the same distance from the surface of calm water would not be in a straight line, thus the earth cannot be concave nor flat. The earth must be some kind of concave shape in which about 50 millimeters per half mile of curvature.
11 December 2017


14 July 2017
Suicide and Mental Health Amongst Children and Youth in the USA
I am conducting a little research on the mental health of children and youth in the USA. Just putting up some of what I found here. First, a history of suicide rates then historical data in other mental health indicators.
 The one above is historical data extracted from a chart that had other age cohorts included. The next one is from a separate paper by the same lead author in the same year but breaks out the same data into two age cohorts.

Next I grabbed data from the CDC and plotted the charts myself. The first two are basically updates on the above charts with the data going from 1981-2015.

Above is the 15-24 data to match the top chart, below is the matching cohort data except with the addition of 10-14 data.

Finally, I wanted to see the detail on the children aged 10-14.

Finally, I want to note the major trend points:
https://qz.com/642351/is-the-way-we-parent-causing-a-mental-health-crisis-in-our-kids/


Next I grabbed data from the CDC and plotted the charts myself. The first two are basically updates on the above charts with the data going from 1981-2015.

Above is the 15-24 data to match the top chart, below is the matching cohort data except with the addition of 10-14 data.
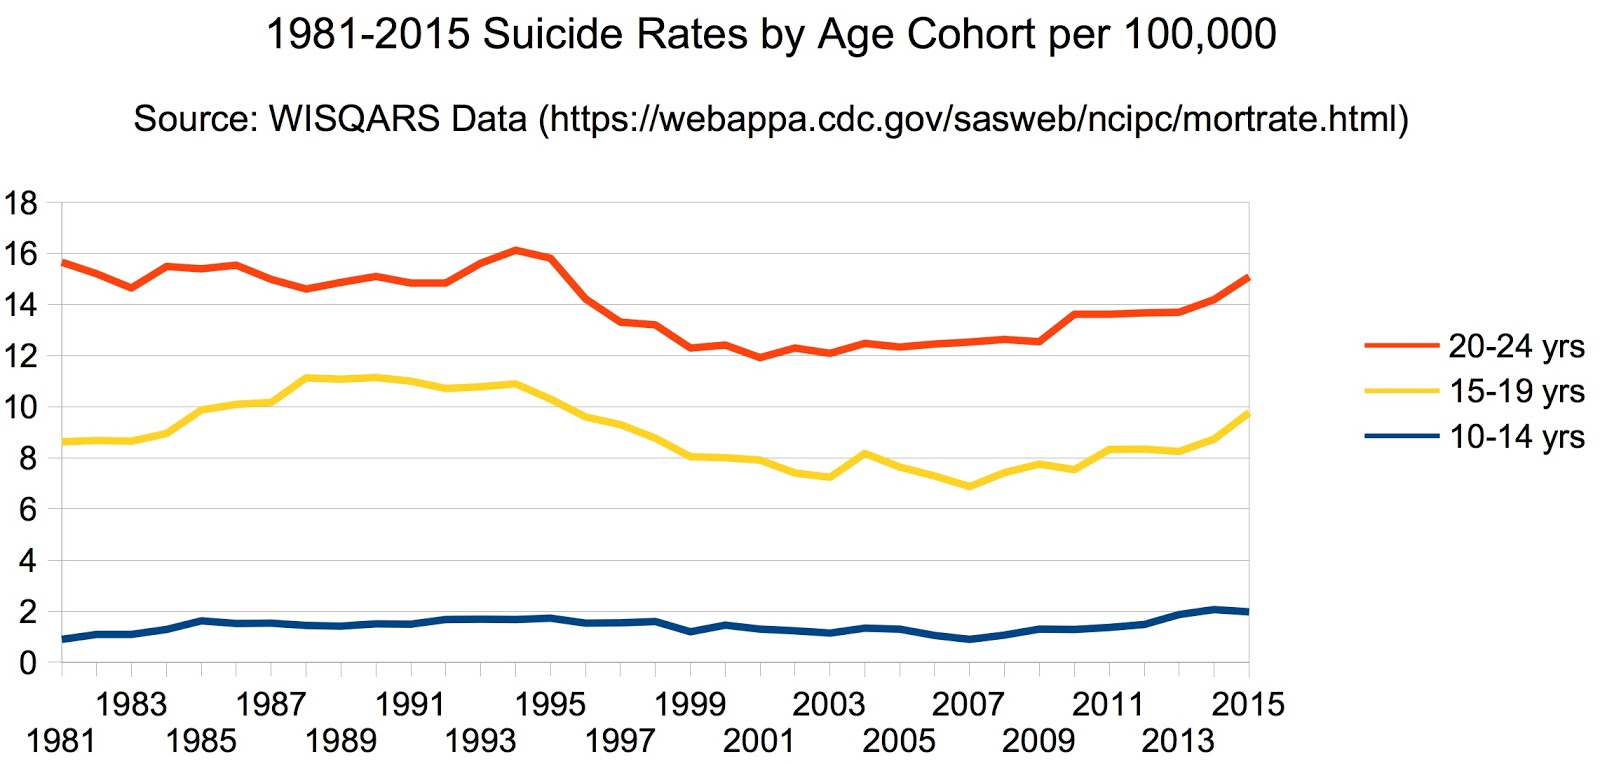
Finally, I wanted to see the detail on the children aged 10-14.

Finally, I want to note the major trend points:
Ages 15-24:
1900 to 1994 less than 2.5 UP to 13.6 (peak)
Ages 15-19
1990 to 2007- 11.1 (peak) DOWN to
6.9
2007 to 2015- 6.9 UP to 9.8
Ages 10-14:
1981 to 1996- .89 UP to 1.7,
1996 to 2007- 1.7 DOWN to .89,
2007
to 2014- .89 UP to 2.1 (peak)
Here is some more data on a different measure of the mental health of youth. Locus of control is an important measure of how a person perceives their situation. A more internal locus of control is healthier while a more external locus is unhealthy. These charts are from meta-studies conducted by Jean Twenge. Source: It’s Beyond My Control- A Cross-Temporal Meta-Analysis of Increasing Externality in Locus of Control, 1960–2002 by Twenge, Zhang, & Im (2004)
 The reference to "children" in the second LOC chart below the authors are referring to high school students.

Here is an excerpt from another Jean Twenge meta-analysis:
Here is some more data on a different measure of the mental health of youth. Locus of control is an important measure of how a person perceives their situation. A more internal locus of control is healthier while a more external locus is unhealthy. These charts are from meta-studies conducted by Jean Twenge. Source: It’s Beyond My Control- A Cross-Temporal Meta-Analysis of Increasing Externality in Locus of Control, 1960–2002 by Twenge, Zhang, & Im (2004)


Here is an excerpt from another Jean Twenge meta-analysis:
"Two meta-analyses find that self-reports of anxiety/neuroticism have increased substantially from the 1950s to the early 1990s. Thus, the larger sociocultural environment—an influence on personality beyond genetics and individual family environment—has a considerable effect on a major personality trait. Samples of college students between 1952 and 1993 show increases on four different measures of anxiety and neuroticism. Study 2 replicates this increase for samples of schoolchildren, showing that sampling bias was not responsible for the college-student results. Both meta-analyses find that self-reports of anxiety increase about one standard deviation over 30-40 years, explaining about 20% of the variance (considerably more than family environment explains in most studies). The birth cohort change in anxiety is so large that by the 1980s normal child samples were scoring higher than child psychiatric patients from the 1950s (Levitt, 1959). In both studies, anxiety levels are correlated with low social connectedness and high environmental threat; economic conditions do not explain the rise in anxiety, even among the socioeconomically diverse samples in Study 2."
Source: The Age of Anxiety? Birth Cohort Change in Anxiety and Neuroticism, 1952-1993 by Twenge (2000)From this Quartz article:
https://qz.com/642351/is-the-way-we-parent-causing-a-mental-health-crisis-in-our-kids/

Another chart from that Quartz article.


New England Journal of Medicine article on Medication.
Source: Trends in Mental Health Care among Children and Adolescents by Olfson, Druss, and Marcus (2015)

Source: Trends in Mental Health Care among Children and Adolescents by Olfson, Druss, and Marcus (2015)

28 December 2016
Bald Eagle vs. Chicken, Who's winning on evolutionary terms?
[C]onsider how to answer the following
question: which bird, species A or species B, has been more
successful in the evolutionary process of natural selection? If you
are like us, we suspect that your first thought would be to compare
the relative numbers of the two birds. With a little more time, you
might decide that you would also like to know about relative sizes
since at equilibrium the environment could probably sustain fewer
large birds than small birds. Controlling for habitat needs you would
seem to have a simple, but fairly accurate, measurement process.
Now let us make the question a little
more concrete: which bird, the bald eagle or the chicken, has been
more successful in the evolutionary process of natural selection?
Shall we do the math? There are approximately 70,000 bald eagles in
North America, a number that is up considerably in recent years
following the bald eagle's near extinction. It is a little harder to
know just how many chickens there are in this country at any given
moment, but our rough calculations put the number somewhere between
1.75 and 2 billion. That means that for every bald eagle there are
twenty to thirty thousand chickens.
Even discounting the figure slightly to
take into account the eagle's larger size and habitat requirements,
the numbers are clear: the standard farm chicken is the bald eagle's
evolutionary superior. But that finding seems absurd. We know the
bald eagle as our national bird, a symbol of strength and power.
Eagles are extremely well adapted for survival in nature, given their
superb flying, hunting, and nest-building abilities. For centuries,
bald eagles thrived, and according to one history, they may have once
numbered half a million .
“They existed
along the Atlantic from Labrador to the tip of south Florida, and
along the Pacific from Baja California to Alaska. They inhabited
every large river and concentration of lakes within North America.
They nested in forty-five of the lower forty-eight states. One
researcher estimated an eagle nest for every mile of shore along
Chesapeake Bay. They congregated on the lower Hudson, and were
extremely abundant along the coast of Maine.”
So then we have missed something. In
determining that chickens are more fit than eagles to withstand
nature's trials and challenges, we have ignored critical situational
influences. Why are there so many more chickens than eagles? The more
obvious and correct explanation is that humans value chickens in a
way that they have not valued bald eagles.
Indeed, there are robust markets in
both chickens and eggs. According to a recent industry-sponsored
survey, Americans consume, on average, eighty-one pounds of chicken
per year—a figure that appears to be going up and that represents
“the highest per capita consumption of any of the major meats.”
They also consume approximately 260 eggs per year. Unsurprisingly,
market pressures ensure that there are many chickens alive at any
given moment.
Well, if bald eagles are so fit, why
did they nearly go extinct and why are there still so few of them?
The following history of the bald eagle helps to shed light on a
different sort of situational influence on the bald eagles' stature
than is imagined in any idealized, unrealistic "natural
selection" script.
“There is no
single cause for the decline in the bald eagle population. When
Europeans first arrived on this continent, bald eagles were fairly
common. As the human population grew, the eagle population declined.
The food supplies for eagles decreased, because the people hunted and
fished over a broad area. Essentially, eagles and humans competed for
the same food, and humans, with weapons at their disposal, had the
advantage. As the human population expanded westward, the natural
habitat of the eagles was destroyed, leaving them fewer places to
nest and hunt, which caused the population of bald eagles to decline
sharply by the late 1800s.
“By the 1930s,
people became aware of the diminishing bald eagle population, and in
1940 the Bald Eagle Act was passed. This reduced the harassment by
humans, and eagle populations began to recover. However, at the same
time DDT and other pesticides began to be widely used. Pesticides
sprayed on plants were eaten by small animals, which were later
consumed by birds of prey. The DDT poison harmed both the adult birds
and the eggs that they laid....
“More than
100,000 bald eagles were killed in Alaska from 1917 to 1953. Alaskan
salmon fisherm[e]n feared they were a threat to the salmon
population.”
According to that history, the threat
to eagles was not that they were ill-equipped to survive in nature,
but that their success as a species did not appear to serve the
interests of humans. Indeed, the eagles competed with human
interests, including commercial interests.
As a result, the grand, and once
ubiquitous, bald eagle was pushed toward extinction. Meanwhile,
chickens were raised in huge numbers to meet the increasing demand
for their eggs and meat. The relative success of chickens over bald
eagles, then, has little to do with the survival of the fittest and a
lot to do with "the survival of the tastiest" or "the
survival of the profittest."
In light of that competition among
birds, look again at how … scholars tend to measure the success of
various schools of thought. … [A]cademics generally assume that
they are competing in some neutral tournament wherein ideas evolve
and good ideas become more prominent while bad ideas disappear.
According to this view, the tournament benefits the outside world by
generating and announcing the winning ideas, which are then relied
upon to help make effective and desirable policy. Thus, when some
ideas are more commonly accepted, are attracting larger audiences and
are having more influence … , the assumption is often that those
ideas, like the bald eagle, soar above their ground-bound, clucking
competitors.
But here is the problem: the
competition among ideas may have much in common with the imagined
competition between chickens and eagles. That is, in both contexts
there appear to be very significant demand-side factors that help
determine which ideas will be most prevalent and seemingly most
successful. For reasons that we have already highlighted, the
"winners" will be those ideas that are valuable to the more
influential participants on the demand-side of the
marketplace—specifically, pro-commercial interests.
from The Situation:
An introduction to the situational character, critical realism, power economics, and deep capture.
By Jon Hanson and David Yosifon
University of Pennsylvania Law Review, Vol. 152, p. 129, 2003-2004
Subscribe to:
Posts (Atom)